R Tutorials
R Introduction
R Syntax
R Comments
R Variables
R DataTypes
R Numbers
R Math
R Strings
R If..else
R Operators
R While Loop
R For Loop
R Data Structures
R Vectors
R Lists
R Matrices
R data Frames
R factors
R Graphics
R Plot
R line
R Scatterplot
R Pie Charts
R Bars
R Statistics
R Statistics Intro
R Data Set
R Max and Min
R Mean Median Mode
R Percentiles
R Examples
R Compiler
 Previous
R Plotting
Plot
The plot() function is used to draw points (marks) in a drawing.
The function takes parameters to specify points in a drawing.
Parameter 1 specifies points in x-axis.
Parameter 2 specifies points on the y-axis.
For its simplicity, you can use the plot() function to arrange two numbers against each other:
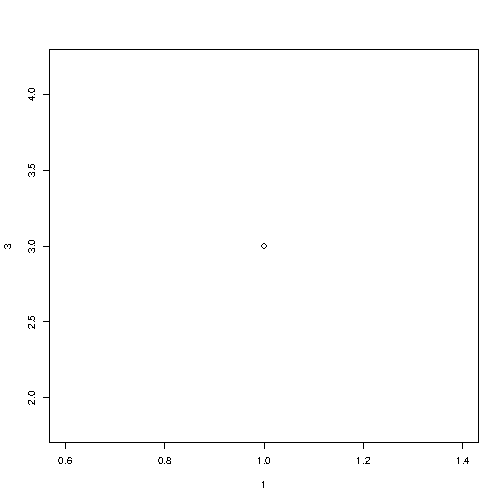
Example
Draw one point in the diagram, at position (1) and position (3):
Result
To draw additional points, use vectors:
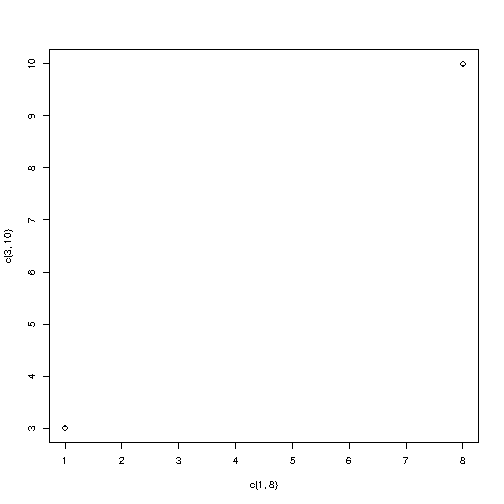
Example
Draw two points in the diagram, one at position (1, 3) and one in position (8, 10):
Result
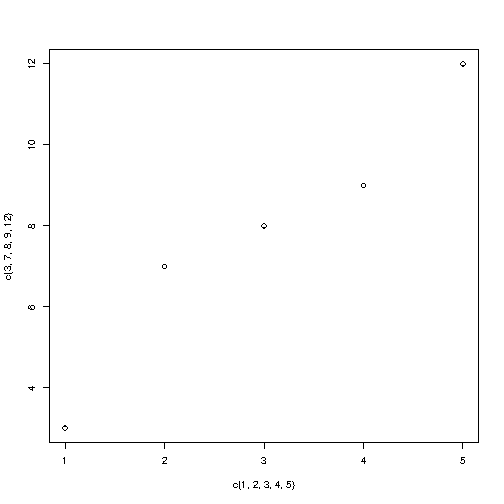
Multiple Points
You can edit as many points as you like, just make sure you have the same number of points on both axis:
Example
Result
For better organization, if you have a lot of values, it is best to use a variable:
Example
y <- c(3, 7, 8, 9, 12)
plot(x, y)
Result
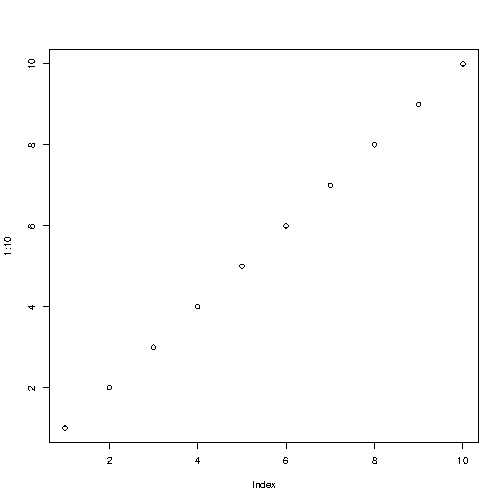
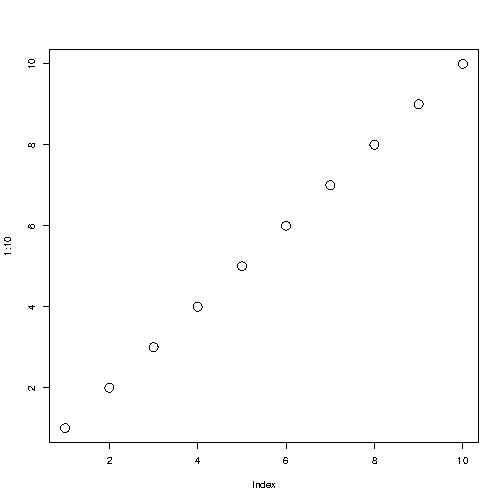
Sequence of Points
If you want to draw dots in sequence, for both x-axis and y-axis, use : operator:
Example
Result
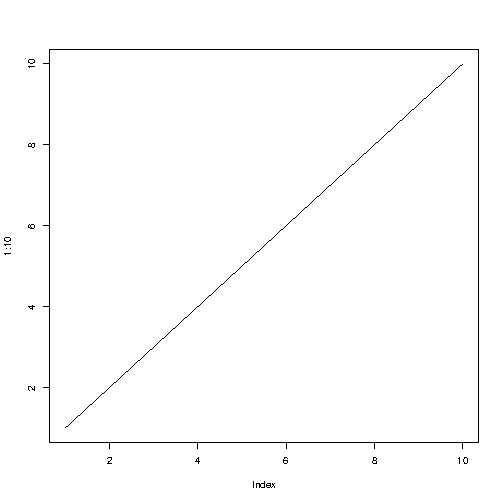
Draw a Line
The plot() function also takes a type of parameter with the value l of drawing a line to connect all the points in a drawing:
Example
Result
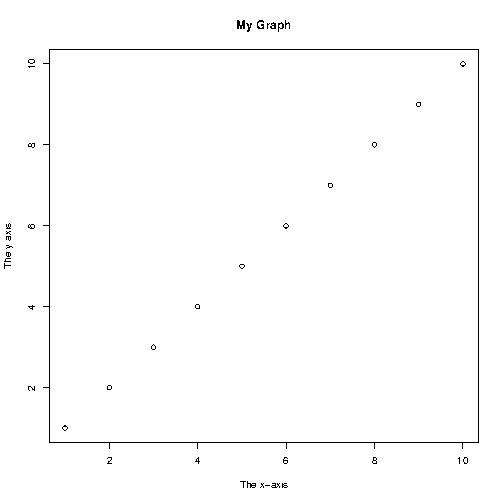
Plot Labels
The plot() function also accepts other parameters, such as main, xlab and ylab if you want to customize the graph with the main heading and the different x and y axis labels:
Example
Result
Graph Apperance
There are many other parameters you can use to change the look of the points.
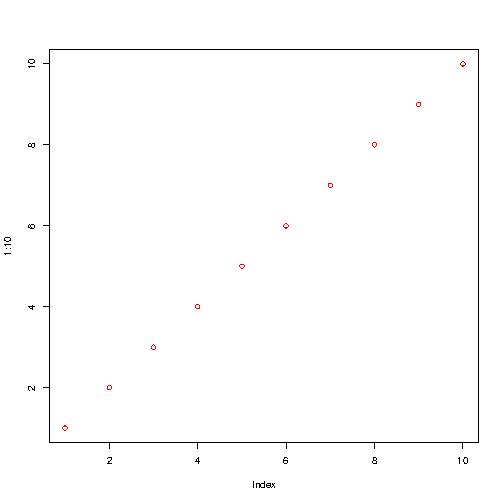
Colors
Use col = "color" to add color to points:
Example
Result
Size
Use cex = number to change point size (1 is default, and 0.5 means 50% less, and 2 means 100% greater):
Example
Result
Point Shape
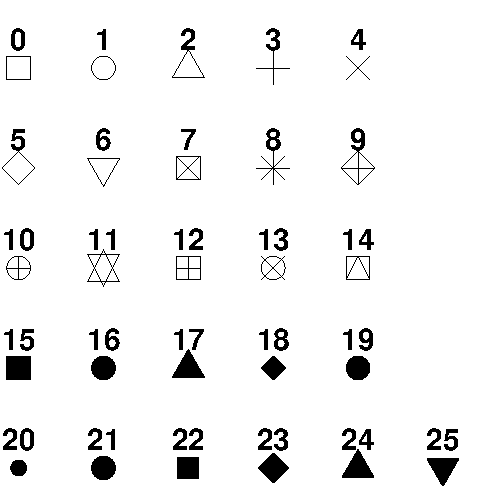
Use a pch with a value from 0 to 25 to change the format of the point:
Example
Result
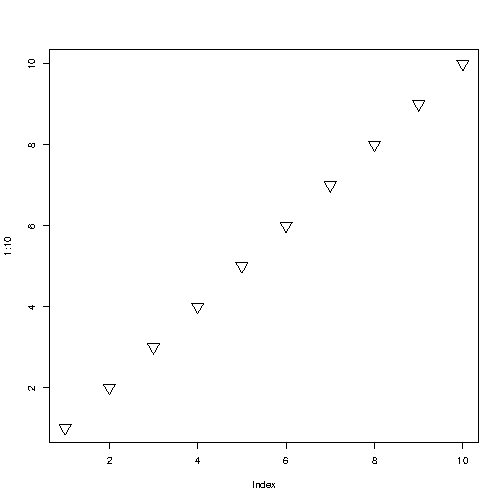
Pch parameter values range from 0 to 25, which means we can choose up to 26 different types of points: