R Tutorials
R Introduction
R Syntax
R Comments
R Variables
R DataTypes
R Numbers
R Math
R Strings
R If..else
R Operators
R While Loop
R For Loop
R Data Structures
R Vectors
R Lists
R Matrices
R data Frames
R factors
R Graphics
R Plot
R line
R Scatterplot
R Pie Charts
R Bars
R Statistics
R Statistics Intro
R Data Set
R Max and Min
R Mean Median Mode
R Percentiles
R Examples
R Compiler
 Previous
R Bar Charts
Bar Charts
The bar chart uses rectangular bars to visualize data. Bar charts can be displayed horizontally or vertically. The length or length of the bars corresponds to the values they represent.
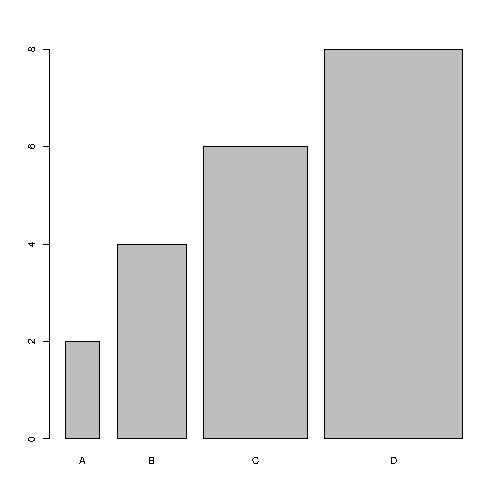
Use the barplot() function to draw a vertical bar chart:
Example
# x-axis values
x <- c("A", "B", "C", "D")
# y-axis values
y <- c(2, 4, 6, 8)
barplot(y, names.arg = x)
x <- c("A", "B", "C", "D")
# y-axis values
y <- c(2, 4, 6, 8)
barplot(y, names.arg = x)
Result
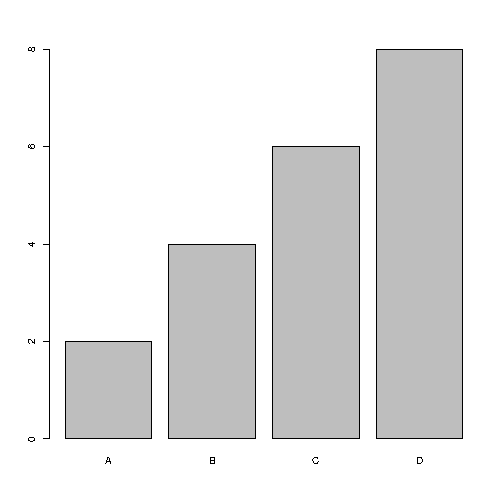
Example Explained
- The
xvariable represents values in the x-axis (A,B,C,D) - The
yvariable represents values in the y-axis (2,4,6,8) - Then we use the
barplot()function to create a bar chart of the values names.argdefines the names of each observation in the x-axis
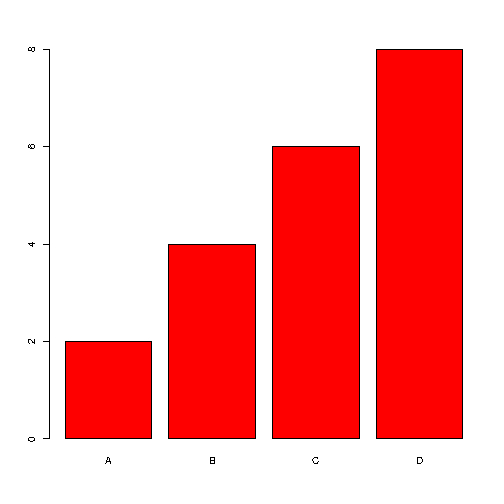
Bar Color
Use col parameter to change the color of the bars:
Example
x <- c("A", "B", "C", "D")
y <- c(2, 4, 6, 8)
barplot(y, names.arg = x, col = "red")
y <- c(2, 4, 6, 8)
barplot(y, names.arg = x, col = "red")
Result
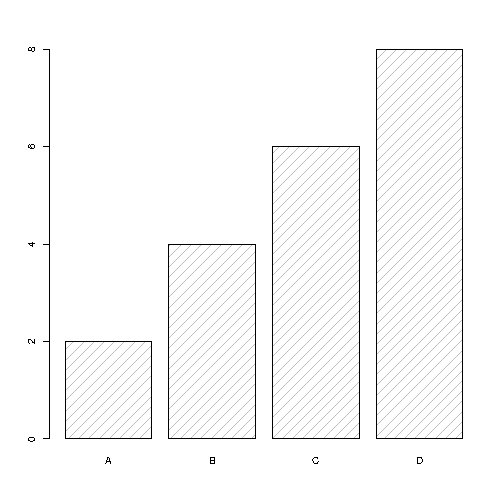
Density / Bar Texture
To change the texture of the bar, use the density parameter:
Example
x <- c("A", "B", "C", "D")
y <- c(2, 4, 6, 8)
barplot(y, names.arg = x, density = 10)
y <- c(2, 4, 6, 8)
barplot(y, names.arg = x, density = 10)
Result
Bar Width
Use the width parameter to change the width of the bars:
Example
x <- c("A", "B", "C", "D")
y <- c(2, 4, 6, 8)
barplot(y, names.arg = x, width = c(1,2,3,4))
y <- c(2, 4, 6, 8)
barplot(y, names.arg = x, width = c(1,2,3,4))
Result
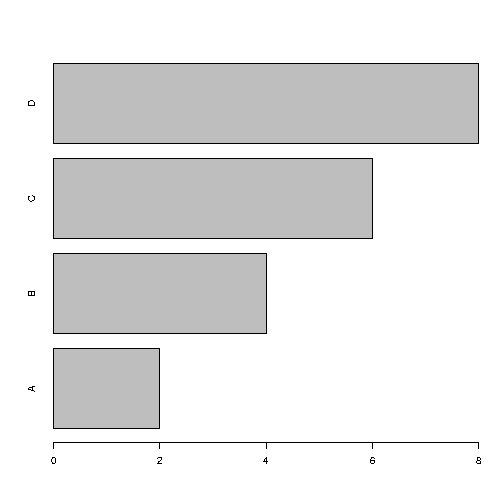
Horizontal Bars
If you want the bars to be horizontal rather than vertical, use horiz = TRUE:
Example
x <- c("A", "B", "C", "D")
y <- c(2, 4, 6, 8)
barplot(y, names.arg = x, horiz = TRUE)
y <- c(2, 4, 6, 8)
barplot(y, names.arg = x, horiz = TRUE)
Result